


How Odyssey uses Google Analytics as a tracking source
One of the biggest benefits of Odyssey Attribution is that we are able to extract the raw data from Google Analytics. How, you are asking? Let us explain
It’s important to see which marketing channels drive most of the value, but if these channels cost you a fortune, you don’t want to spend all your marketing budget there. Therefore, including both costs (ad spend) and revenue in your multi touch attribution model is essential.
Last week I described how you could start building your attribution model based on the 3 simple KPIs that form the basis of the algorithms we use at Odyssey. It’s just about length, density and position. Together, this will give an incrementality rate for every traffic source on a granular level.
The incrementality of every traffic source is the basis of your attribution model, because it tells you what percentage of a sale can be attributed to the traffic source you’re looking at. Including the costs and revenue will give you the actionable insights you need to optimize your marketing spend.
Let’s get back to our example of last week in which we compared paid search and paid social with each other. The average customer journey length when paid search was involved was 4; for paid social it was 5. Let’s assume that paid search’s density was 25% and paid social’s density was 40%. The average position of paid search turned out to be 0.5 on a scale between 0 (beginning) and 1 (end). Paid social’s average position was 0.6.
In our first click linear model this results in an incrementality for paid search of 25% and 32% for paid social. In a future blog post I’ll explain more about different attribution models; it’s a bit too much to include it in this one :).
Now we know the incrementality of our most important channels, we want to know how much budget we should have spent on them.
In this example, paid search was involved in 10.000 transactions with a total revenue of EUR 1,200,000, which means an average order value of EUR 120. Paid social was involved in 10,000 transactions as well, but the average order value was only EUR 90 resulting in EUR 900,000 of revenue. This kind of revenue per traffic source is what we call “[participated revenue]https://odysseyattribution.co/academy/participated-revenue/)”, because the traffic source participated in this amount of revenue.
If we multiply participated revenue with incrementality, we get to a traffic source’s “attributed revenue”, because this will give you the amount of revenue that should be attributed to this traffic source. For paid search this means EUR 1,2000,000 * 25% = EUR 300,000. For paid social this means EUR 900,000 * 32% = EUR 288,000
Our total revenue was EUR 10,000,000 and our total marketing budget was EUR 2,000,000, which is what we call a maximum media spend of 20%; for every transaction, we’re willing to spend 20% of its value on digital marketing.
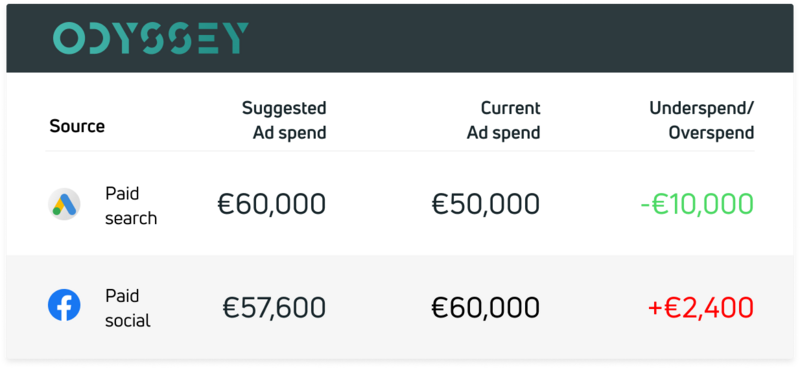
If we want to know how much budget we should have allocated to paid search and paid social, we have to multiply our maximum media spend with the attributed revenue of the channels. For paid search this means EUR 300,000 * 20% = EUR 60,000. For paid social this means EUR 288,000 * 20% = EUR 57,600. We call this the “suggested ad spend”.
Deducting the suggested ad spend from the current ad spend will finally give you the under- or overspend per traffic source.
Let’s say that we’ve spent EUR 50,000 on paid search and EUR 60,000 on paid social. This would mean that paid search has EUR 10,000 underspend and paid social has EUR 2,400 overspend. This is really actionable, because it tells us where to cut costs and where to invest more budget, because it will result in more incremental sales.
Including costs and revenue into our attribution model therefore helps us answering the big questions about marketing attribution:
As you can see, all of these questions have been answered in our analysis above. Does this mean that we have “solved” attribution? No. Understanding how to build your attribution model and including incrementality, revenue and costs is just the beginning. From this point, it’s all about running experiments, learning from it and continuously optimizing your campaigns. I’ll share more on these topics in future blogs!
How Odyssey uses Google Analytics as a tracking source
One of the biggest benefits of Odyssey Attribution is that we are able to extract the raw data from Google Analytics. How, you are asking? Let us explain
What if we could re-start affiliate marketing?
The lack of a proper attribution model within the industry is actually more or less how we got to the first version of Odyssey. However, there are more topics in which I believe the affiliate industry is completely missing the point.
How to start with marketing attribution?
The most important reasons for the slow adaptation of marketing attribution among marketers are complexity, a misunderstanding about what AI could do and Google's domination of the digital marketing industry in general.